
Tony Stark: "You said one out of fourteen million, we win, yeah? Tell me this is it."
Dr. Strange: "If I tell you what happens, it won’t happen."
Tony Stark: "You better be right."
-Avengers: Endgame
This summer the U.S. housing market fell in some markets at a velocity we’ve seen perhaps 1-2 times in the past century. Home prices in Opendoor’s top three markets by volume, Phoenix, Atlanta and Dallas, are each down 9 – 15% over the past 3 months, according to Redfin and Realtor.com data. That's an absurd sentence to write.
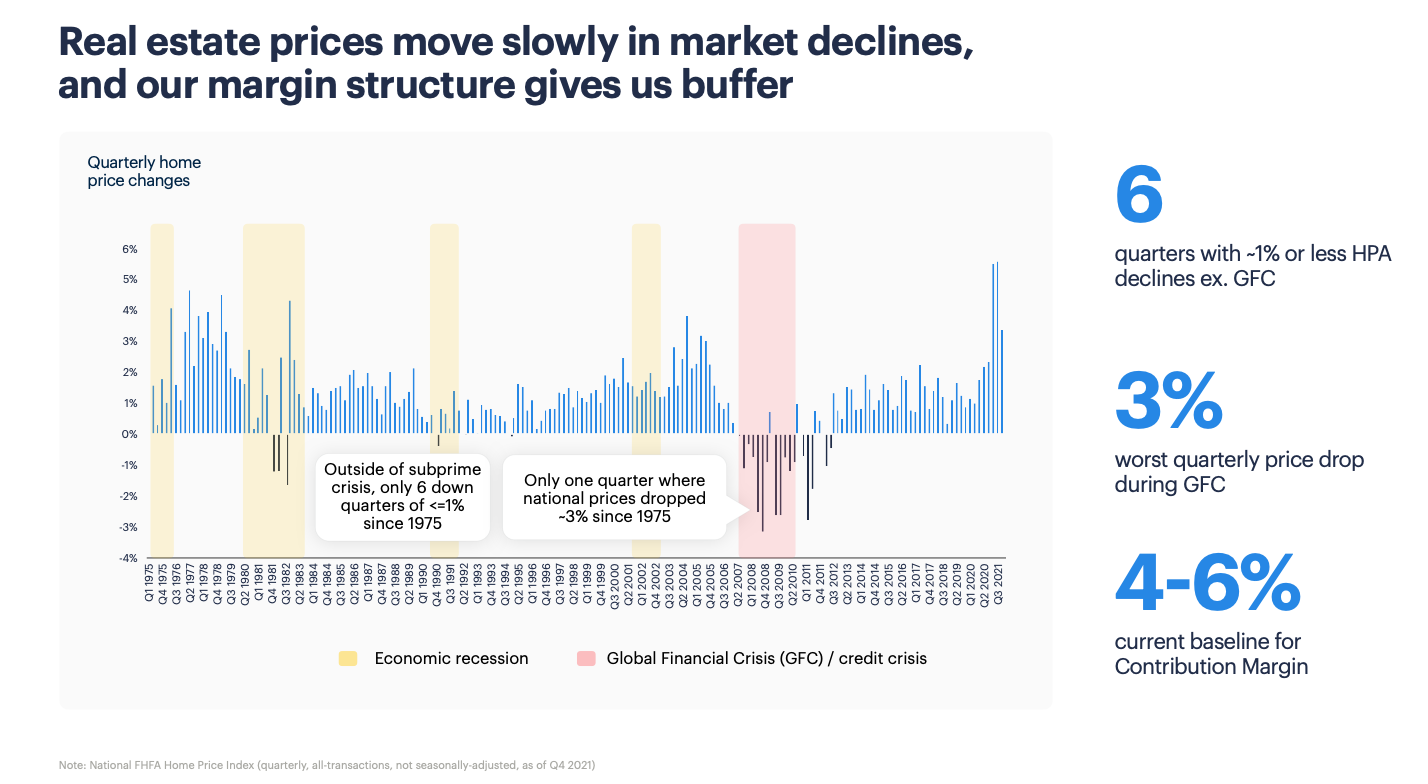
To put this in context – during the Great Financial Crisis, the worst quarterly price drop across all U.S. homes was 3%, according to the National FHFA Home Price Index.
Recent news articles have capitalized on alternative data provider reports that Opendoor’s margins are struggling. Indeed, Opendoor is underwater in more than a few markets.
But it’s worth noting how historic these price declines are. It’s easy to point to Opendoor’s struggles today and say “See, the model doesn’t work.” For years we cruised carefree with easy monetary policy with HPA rocketing, until this summer the FED pulled the e-brake on the highway.
It’s not that Opendoor didn’t predict this housing downturn (they saw it coming and described a strategy for it in Q1 ’22 ER). Rather, it’s that a decline of this velocity couldn’t be predicted – because nothing like it had ever happened before.
Not unexpectedly, Opendoor has garnered little sympathy for the unprecedented characteristics of today’s recession. Many have suggested the company is priced as it should be; for bankruptcy.
While I am long Opendoor and widely constructive on iBuying and PropTech, I’m not here to spin results or cast the company in a false light. There’s no way around it – it’s ugly out there today. Frankly, when I first invested in Opendoor I didn’t include the current housing landscape as a potentiality.
That said, I’m bullish on anyone who sets out to improve the consumer experience in real estate, and particularly those persistent, gritty founders who are willing to be misunderstood for long periods of time to make their vision a reality.
This article brings data to the discussion. It’s about navigating what’s unprecedented, whether this market is survivable, and getting up after a fall.
Let’s get started.
This summer, Opendoor purchased many thousands of homes. Within 3 months (traditional holding time for the company) housing prices crashed, and those homes were worth far less than purchase price. Don't get me wrong; this is NOT a Zillow situation. In Q3 '21 Zillow found themselves paying far more than a home was worth in real time, and there was no housing crash to blame (in fact, housing went on to appreciate double digits from there).
Between Q2 '22 and Q3 '22, there was a housing crash.
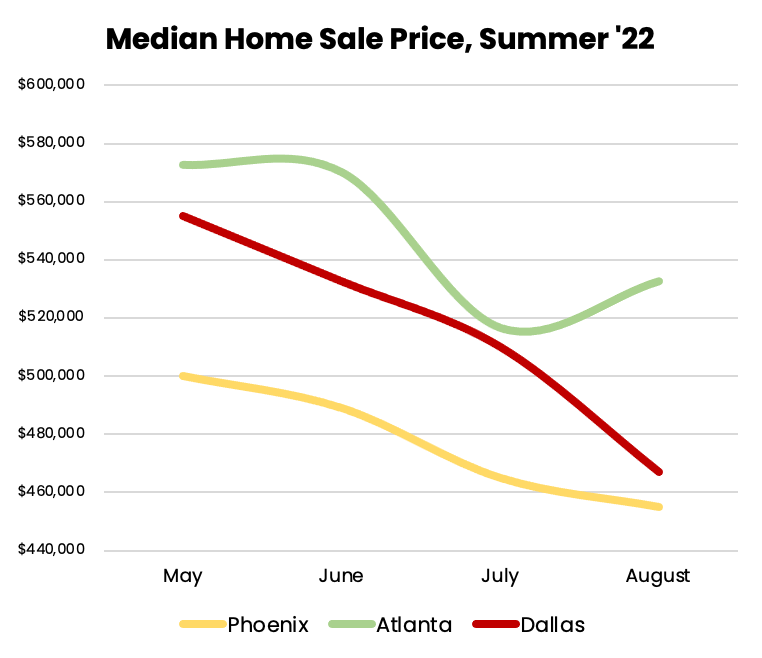
Source: Redfin.com, Single Family Homes
From May to August median sale price in Phoenix, Atlanta and Dallas dropped 9%, 9.8% and 15.8%, respectively. These are wild numbers, and indicate anything purchased in April - June suffered massive, near immediate value declines.
So how does Opendoor get out of the pit of despair? Two mechanisms:
1.) Sell these homes quickly
2.) Purchase new homes at wider spreads to replenish inventory + margins.
Opendoor is successfully implementing mechanism #1, with September home sales volume nearly double the monthly lows of August and July. But mechanism #2 is a bit trickier to observe and quantify. Don’t worry – we can.
I previously introduced the concept of spread, which is any profit Opendoor makes on a home that can’t be attributable to home price appreciation (HPA). This calculation excludes ancillary services or renovations, and is the margin lever for the company in a down market.
In an up market, the margin lever is HPA. Buy a home, watch as it appreciates, sell and book the profit. In a down market, when instant offer and equity in your pocket is at a premium, Opendoor should be able to purchase homes for less than they are worth today (and that difference is spread). If they can then sell that home before it depreciates past the spread, it’s a profit.

Above is a lightly redacted excerpt from an analytics distribution we sent out to our institutional clients in early August. We estimated Opendoor would begin buying inventory at meaningfully lower prices by mid-August and list those homes with higher margins by the end of the month. This was difficult to estimate at the time because visibility into home purchases is delayed by 4-6 weeks (versus sales data, which we have visibility on 4-6 weeks into the future).
Even still, that’s what we predicted. Fortunately, this turned out to be true.
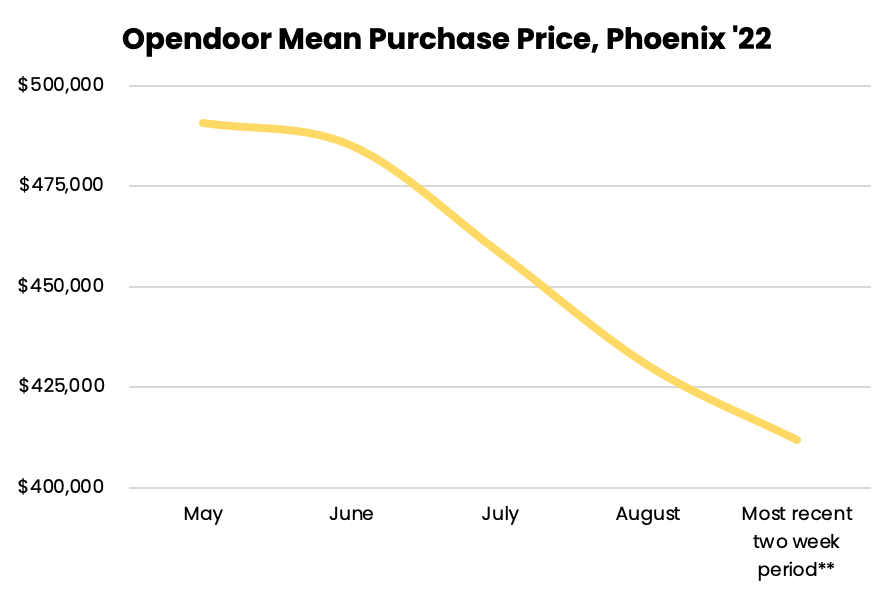
**Most recent two week period: 8/29 – 9/12
In fact, over the most recent two week period, Opendoor’s mean purchase price for Phoenix homes was $80,000 lower, or 16.11% less than homes purchased in May.
Now I could just leave it at that. Write a clickbait headline that says “Opendoor is spending 16% less on Phoenix homes today versus May” and go cook a brisket, walk my dog. But I want these data I present to be accurate first and foremost.
So we dug deeper into cohort mix. Is Opendoor just buying smaller, older, dumpier homes, which means spending 16% less than May levels means nothing?
Opendoor’s Purchase Data: Phoenix Cohort
|
|
Avg. Age of Home (years) |
Bedrooms |
Baths |
Price per sq foot ($) |
|
May |
26 |
3.29 |
2.32 |
266 |
|
June |
25 |
3.28 |
2.33 |
262 |
|
July |
27 |
3.33 |
2.27 |
253 |
|
August |
28 |
3.13 |
2.2 |
250 |
|
Most recent 2 weeks* |
27 |
3.19 |
2.26 |
240 |
*Most recent two weeks: 8/29 – 9/12
It turns out Opendoor is buying similarly aged homes, albeit slightly smaller compared in May. However, we confirm Opendoor is also paying $26, or 9.8% less per square foot per home.
This spread will manifest as margin on resale. And for a company that purchases thousands of homes in Phoenix each quarter, these savings add up in the tens of millions each month.
The differences are even more stark in Atlanta.
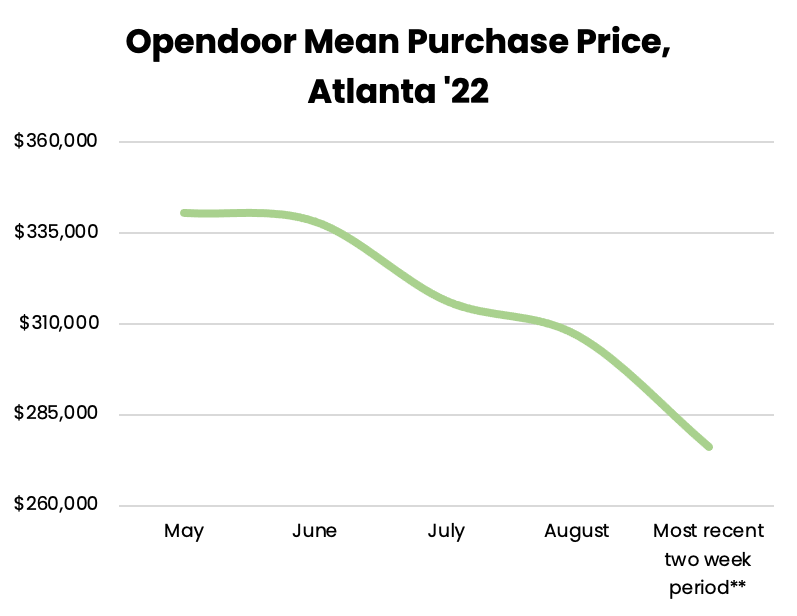
Compared to May, Opendoor today is paying $64,000 less, or 18.9% lower for Atlanta inventory. Unfortunately we cannot analyze Atlanta home characteristics as readily as Phoenix, as many Atlanta homes have basements, which confounds the analysis. (Whether the basement is finished, whether public data regarding the basement are up-to-date, not to mention how to price a square foot of an Atlanta basement, are beyond the scope of this report. Technically we can do this analysis, but it would be a huge manual slog and Datadoor is my second job.)
All that said, similar to Phoenix, Opendoor appears to be buying slightly smaller homes today (3.23 Bedrooms and 2.34 Baths) compared to May (3.34 Bedrooms and 2.58 Baths), but unquestionably Opendoor is paying hundreds of basis points less per home here as well.
But now we get to the heart of it. Are these improvements in purchase cohorts manifesting as improvements in listing margin?
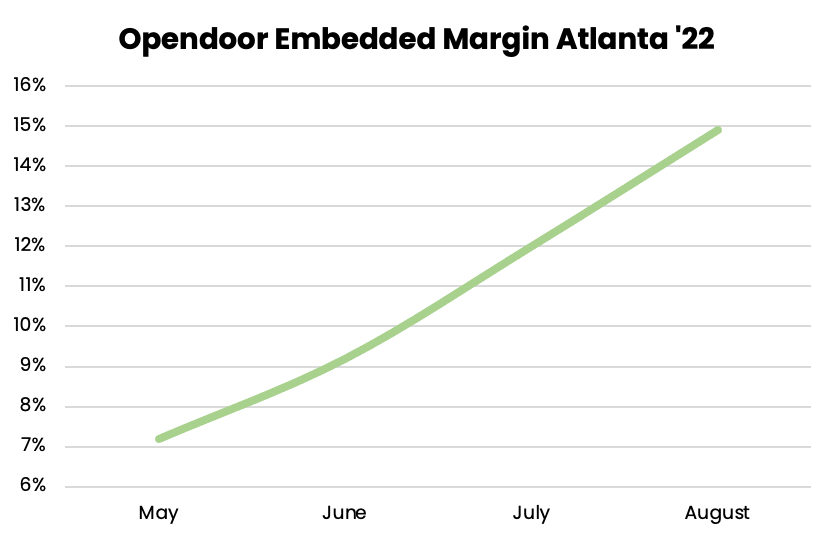
*Embedded margin is the buy-to-list premium of homes plus 5% purchase fee. This is a rolling metric, and embedded margins are subject to price cuts and sold listings being removed. It's important to remember that embedded margin is highest the nearer we are to today. As this is functionally a buy-to-list premium metric, homes listed more recently are not subject to as many price cuts as homes listed 3 months ago, which slightly overestimate more recent relative to older embedded margins.
This graph displays the embedded margin of homes based on the month purchased. For example, the embedded margin of listed homes purchased in August is just over 15%. Despite record price declines in Atlanta, Opendoor’s embedded margins slingshotted beyond 10% in less than two months, an impressive response from the depths of May.
But what about Phoenix? If you read "The Phoenix Problem," you know Phoenix is where Opendoor was hit hardest by the housing crisis, so embedded margins trends here are critical.
The below graph is the most important visualization in this article. It tells the story of how Opendoor is responding to historic price declines in its oldest, and most deeply affected market.
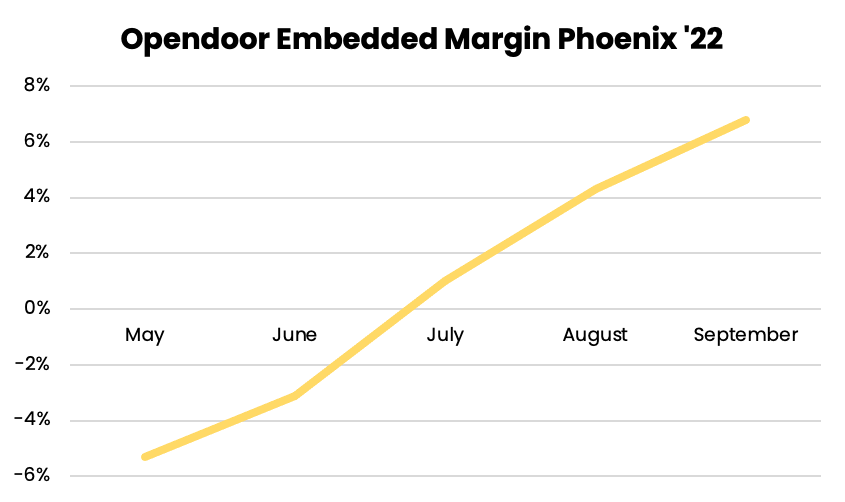
Phoenix embedded margin is up 1200+ basis points over the past 4 months. In October we may actually see normalized listing margins for Phoenix.
While there's clearly more work to be done, this is not a charicature of a company going belly up. This is the steady, functional, incremental grinding of a company responding to a setback and getting back up.
One of the things we talk about internally is to have a hulk mentality. What that means to us is that it’s important to build strength through adversity. And so as things get more difficult, and things will always be very hard whatever you do, you should find strength.
Eric Wu, CEO, Opendoor
Closing Thoughts
Housing is so polarizing it can be challenging to separate signal from noise.
We started Datadoor with the goal of bringing data and clarity to the Opendoor model (and one day other PropTech companies). Despite rapid growth and use of our platform, we've recently seen multiple exaggerated reports using inaccurate data from both sides of the discussion.
U.S. housing jacknifed from record appreciation to record depreciation, with the FED unapologetically determined to crash the market. Yes, Opendoor will lose hundreds of millions between now and the start of 2023 as it right-sizes inventory. This is the story everyone is aware of. But Opendoor will also post positive adjusted gross margins in Q3 despite these historic circumstances.
We are in the endgame now. For my part, I can't predict where housing goes from here, how much higher rates will rise, or whether Opendoor will surmount the heavy odds ahead. What I can share is evidence that the company is responding robustly to this hostile environment. Opendoor is doing exactly what it always said it would do in a down market - selling marked down inventory rapidly and replenishing unit economics with high-spread homes.
We continue to monitor performance and endeavor to deliver clarity.
Tyler
Institutional Grade iBuying data.
For Everyone.
Create an account to get access to Opendoor data and analysis.
Create an accountJoin the discussion
Continue the conversation about this article in our Discord community.
Join our Discord