Introducing Spread: Opendoor’s profitability is less dependent on home price appreciation than you think

Opendoor reported earnings last Thursday, blowing the doors off consensus estimates. Massive beat on the top and bottom lines, stellar guidance and the team’s first profitable quarter to boot.
Yet the bears have already begun to regroup, claiming Opendoor’s success is due only to record home price appreciation (HPA) – that once this housing market cools, we’ll wave goodbye to profitability.
On an instinctive, intuitional level, I patently disagree. As a liquidity provider Opendoor is naturally positioned to win in down or flat cycles. And liquidity providers fundamentally offer more value in uncertain times.
But I didn’t have the data to support this intuition – until a few months ago. That’s what’s been so great about Datadoor – we now have the source data to cut through the clutter and rigorously test our ideas.
Today is the first in a series of regular Opendoor content and analyses we plan to publish on the Datadoor website. This first note will cover Spread, and the many ways we overestimate HPA's import.
Introducing Spread
In one breath, "Spread" is the percent over/under purchase a home is sold for, subtracting away HPA. The formula is rather straightforward as well:
Spread = Buy-to-Sale Premium (BTSP) – Home Price Appreciation (HPA)
For example, if I buy a home for $100k, in three months it appreciates by 10% ($110k), and I sell it then for $110k, the spread is $0.
However, if I sell that home for $115k, the spread is $5k.
This metric is important because it allows us to determine if Opendoor is reliant on HPA to achieve target gross and contribution profit margins.
I will be the first to say that if Opendoor requires the hottest housing market in modern memory for profitability, it’s going to remain a bad investment.
To sort out the truth, we need to determine the impact of HPA on Opendoor's sold inventory in the recent quarter. By comparing holding time and HPA trends over those specific time periods, we can disentangle HPA values across the 12,100 transactions the Datadoor engine captured for Q1.
We start with the below chart, where you will find Opendoor’s Q1 holding data, separated into cohorts by month sold.
Opendoor Q1 Holding Time
| Month | Holding Time | Pending to Sold | HPA exposure (Buy-to-Pending) |
| January | 129 | 35 | 94 |
| February | 137 | 29 | 108 |
| March | 137 | 29 | 108 |
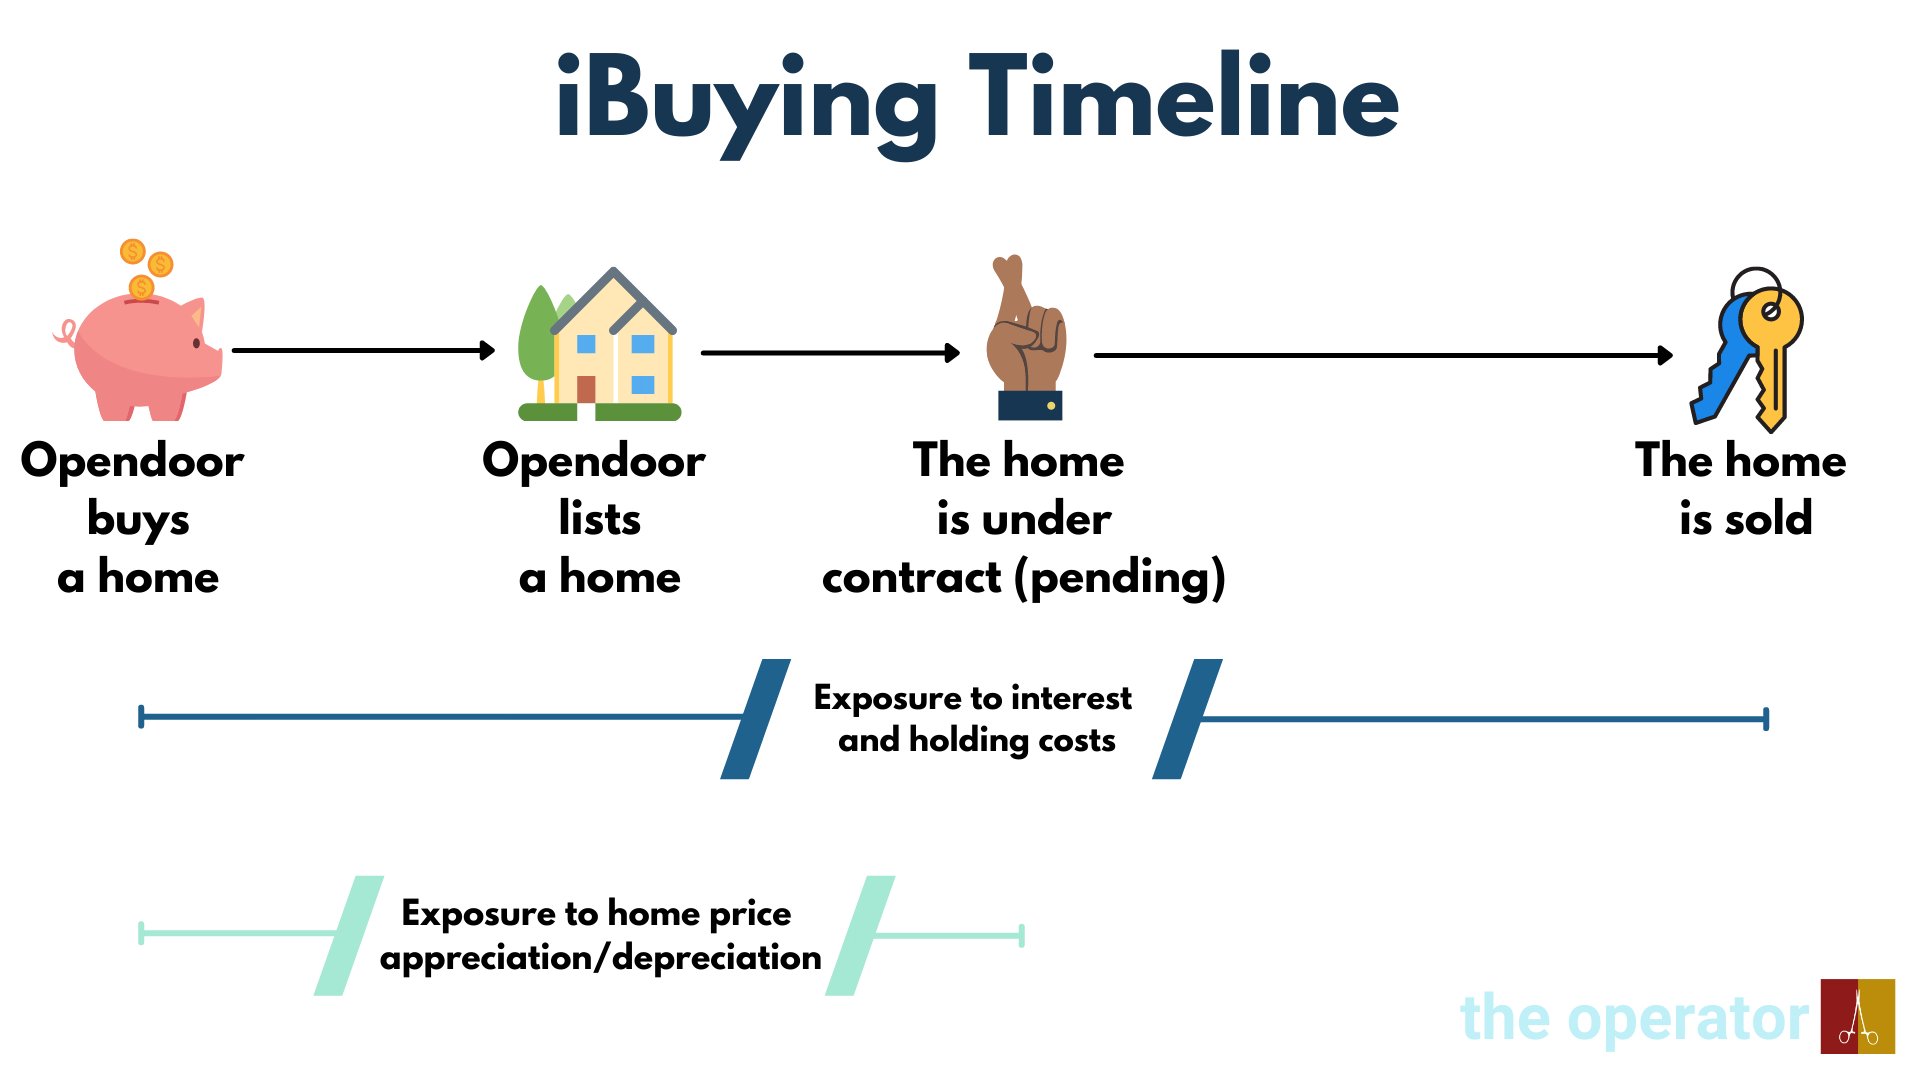
Holding time is the period from Opendoor buying a home to Opendoor selling that home (Buy-to-Sold). But it’s important to remember there are several critical steps in between, steps that influence interest costs, holding fees and HPA exposure. These steps are:
1.) Buy-to-List: The period of time from buying to Opendoor listing the home for sale. During this time the home is generally repaired and cleaned.
2.) List-to-Pending: The time it takes from Opendoor listing the home to that home being under contract with a buyer. Roughly 70 - 75% of “pending” sales become confirmed sales, and these pending sales can fall through for any number of reasons. Note: once the home is under contract (pending), it no longer has exposure to HPA, provided the sale is ultimately made.
3.) Pending-to-Sold: The length of time between being under contract (pending) and being officially owned by that buyer.
To really hammer these concepts home, allow me to show off my dope Canva skills:
But once we have the buy dates and holding periods for the >12k transactions we captured in Q1, we must match U.S. HPA trends to them to divine HPA contribution for each home sold. To do this, we can use FRED housing data:
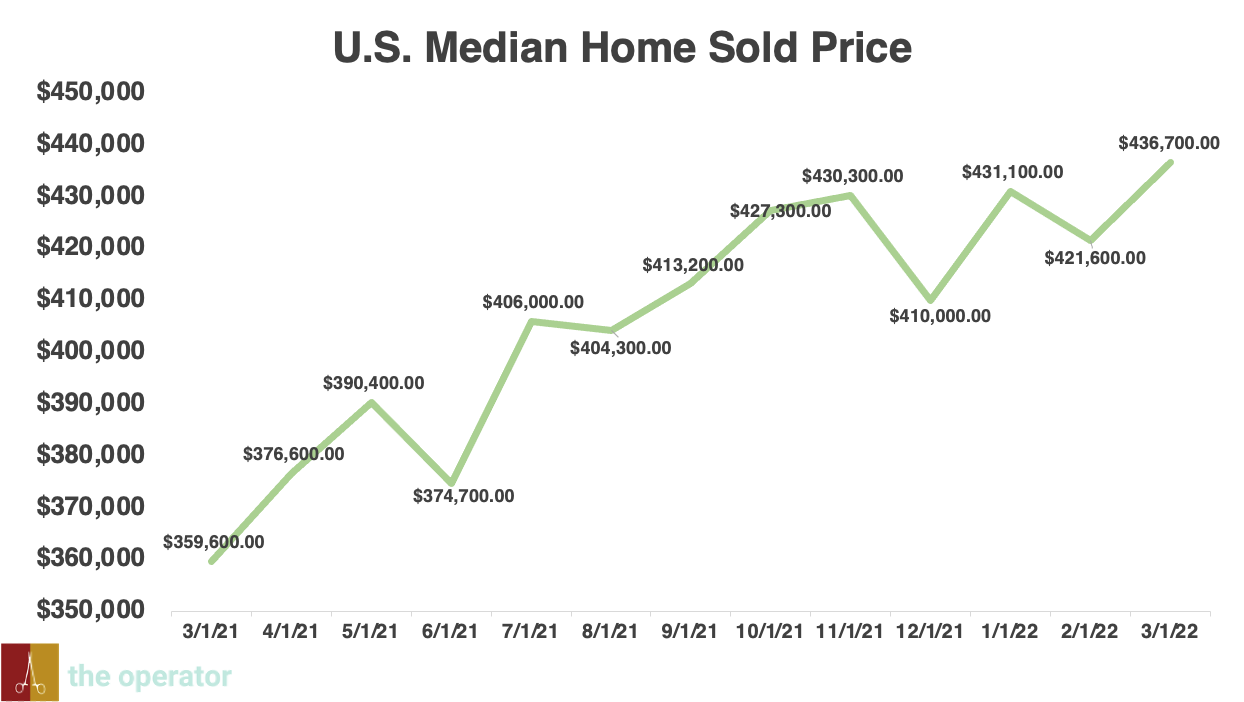
Note: FRED U.S. housing data may not be entirely comparable to Opendoor’s inventory and the markets it operates in. That said, Opendoor is quite diversified today, transacting in 48 markets. Even Opendoor’s top 2 markets, Atlanta and Phoenix, only represent 14% each of Opendoor’s sales, and markets #3 and #4 are each half the size. I acknowledge there are limitations to the comparisons that can be made here, but I think the overall trends support the core thesis.
Given the above FRED chart, you would be forgiven for thinking Opendoor's Q1 had massive tailwinds of HPA behind it. But when you actually crunch the numbers, it turns out this thinking is incorrect. Using the methodology laid out above, I calculated HPA contribution for every home sold in Q1. Furthermore, I divided the data into monthly cohorts to arrive at a composite HPA percentage:
Opendoor Q1 HPA Impact
| Month | Composite HPA |
| January | -0.81% |
| February | 3.74% |
| March | 0.63% |
| Q1 Total | 1.65% |
If the above table doesn't shock you, the following will:
For the entire quarter of Q1, Opendoor’s 10.4% gross profit margin benefitted from only 165 bps of HPA uplift.
And only in February were there significantly positive HPA tailwinds, a very helpful 3.74%. Based on these data, February should have had the highest gross profit margin, right? Because record HPA is the only way Opendoor could have a profitable quarter?
Wrong.
Opendoor Q1 Spread
| Month | HPA | Gross Margin | Buy-to-Sale Premium (BTSP) | Spread (BTSP - HPA) |
| January | -0.81% | 8.70% | 3.70% | 4.52% |
| February | 3.74% | 10.20% | 5.20% | 1.46% |
| March | 0.63% | 12.00% | 7.00% | 6.37% |
Paradoxically, March was the most profitable month in Q1 despite this cohort seeing only 63 bps of HPA.
How can this be?
The truth is that Spread saved the March cohort, and gross margins reached a zenith of 12% driven by 637 bps of Spread. Spread was highest in January and March, the two months of lowest HPA. The February cohort had the highest HPA but the lowest Spread, at only 1.46%.
To better internalize these results, I found an interesting strategic note hidden in the Q1 2022 Shareholder Letter:
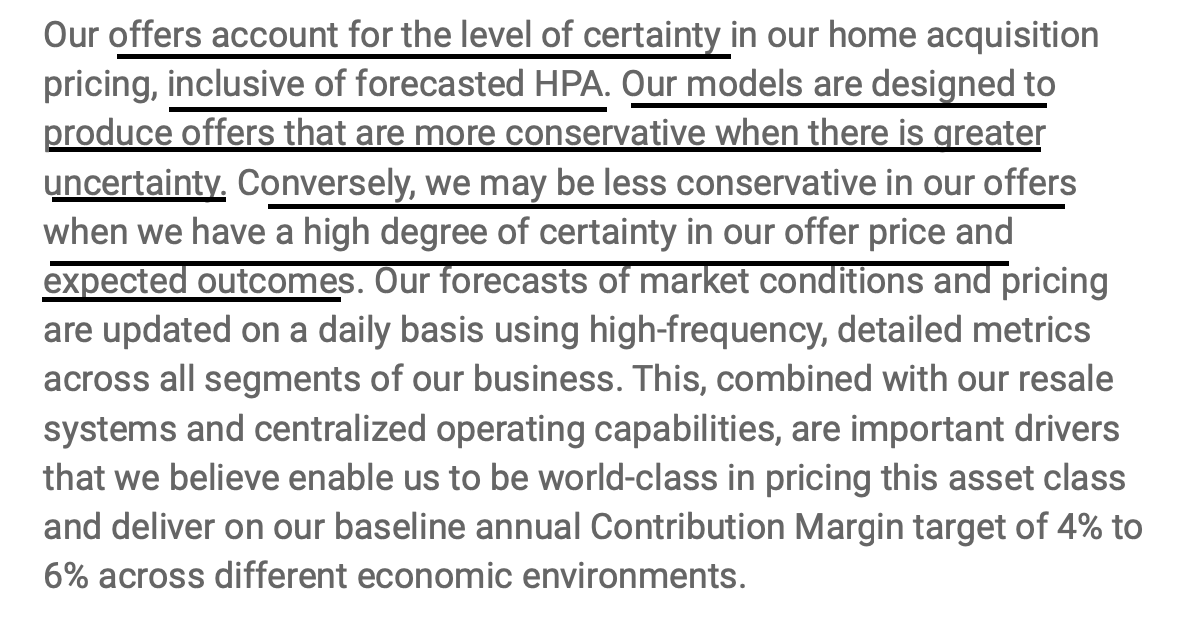
Opendoor’s management has previously described the business model as cycle agnostic, and I believe Spread best validates that perspective. We should expect Spread to rise in any periods of uncertainty or slowdowns, to offset the HPA-driven margin improvements characteristic of a hot market.
Perhaps the most impressive aspect of these data is that it appears Opendoor can correctly read near-term HPA dynamics.
For example, homes sold in March experienced only 63 bps of HPA, but Opendoor was able to purchase the inventory for those sales many months earlier at a spread of 637 bps to maintain gross margins. Similarly, February sales benefited from an excellent 374 bps of HPA, which means it did not need to rely on Spread (only 146 bps) to purchase that cohort of inventory.
The Takeaway
Spread and HPA are two profitability levers that may be individually pulled in any real estate environment.
We can expect HPA to contribute most to Opendoor’s GPM during hot real estate cycles, and Spread to contribute most to Opendoor’s GPM during cold cycles. And whereas HPA is more a sales efficiency metric (can sell for higher because the home is valued for more), Spread is a buying efficiency metric – more conservative offers are made if Opendoor expects slowing HPA, or a downturn. In this way, Spread can allow for similar if not higher profit margins than HPA (see March cohort, Spread of 6.37% for example) in a down market.
In fact, in a down (or buyer's) market Opendoor can make lower offers (larger Spread) and experience higher rates of conversion.
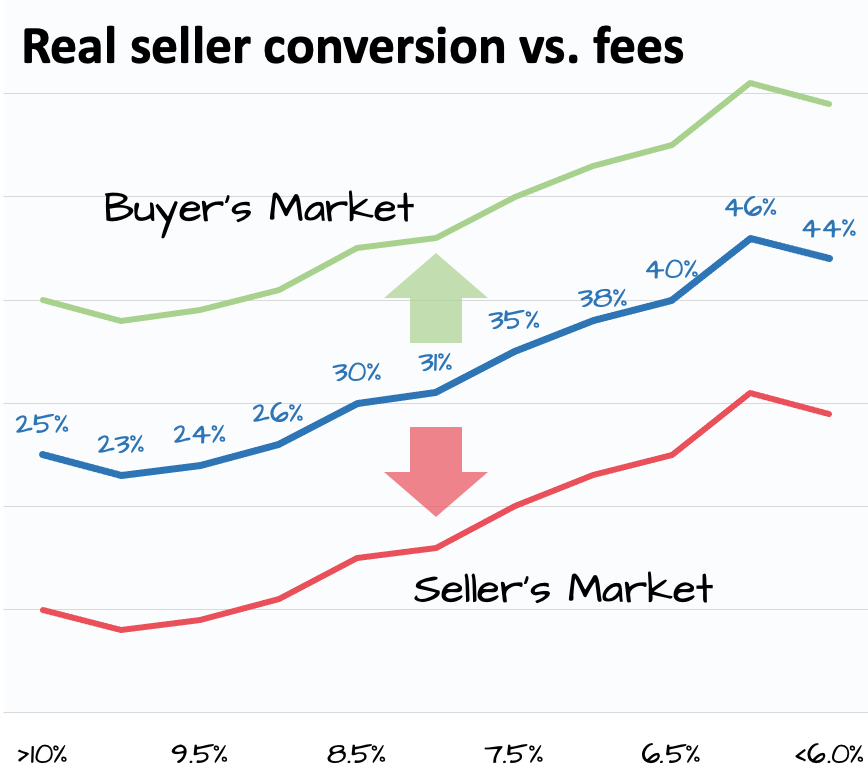
Source: The Operator
People crave liquidity most during uncertain times. This means in a buyer's market conservative offers will be more often accepted and growth maintained, a critical pillar of the market agnostic thesis. Opendoor guided for a slowdown in HPA over the second half of this year, which means Opendoor will lean more heavility on Spread rather than HPA to maintain margins. The above data indicate this is not only possible, but likely.
Opendoor’s actual Q1 performance will be discounted as an easy result given much-sensationalized real estate trends. But the actual dynamics of the quarter continue to demonstrate how misunderstood the business model is. Opendoor has found a way to navigate an unprecedented real estate environment with grace and nuance, and we expect Spread to remain elevated throughout any periods of uncertainty.
Institutional Grade iBuying data.
For Everyone.
Create an account to get access to Opendoor data and analysis.
Create an accountJoin the discussion
Continue the conversation about this article in our Discord community.
Join our Discord