
Opendoor has more homes on the market today than any other moment in the 8-year-old company's history.
14,830 homes, to be exact.
Spiking mortgage and interest rates, home price declines, and a vacuum of demand softened the market like a roundhouse to the liver.
Opendoor is trying to sell more homes, and faster. Gone are the days of warehousing inventory, or listing homes well over purchase price, patiently waiting for home price appreciation or demand to catch up. Today, Opendoor is listing purchased homes faster than any other point in 2022, and at lower buy-to-list premiums.
So, is the company panicking, or is this the "transition to down market" playbook? Maybe it’s a bit of both. Truthfully, it's hard to imagine looking down the barrel of the current market conditions without blinking.
The facts are murky, clouded by real estate catastrophists-slash-experts, but the headline is we are in a down market. Given the volatility ahead, we believe listings data to be the most telling segment of analysis for Opendoor's ongoing execution. For this post, I used our new listings engine to look critically at Opendoor's preliminary performance in its two key markets.
Buckle up.
What Happened in Phoenix?
In Q2 of 2022, the two markets of Phoenix and Atlanta accounted for 28.7% of Opendoor's total sales. This is material concentration. These are Opendoor's oldest established markets, perhaps most reflective of the company's ideal performance.
But Phoenix is burning.
As of today, Opendoor’s listings in Phoenix have the 43rd lowest embedded gross margin out of 48 markets with listed inventory (embedded gross margin: the expected gross margin if all listings sold at today’s listed prices including 5% purchase fee).
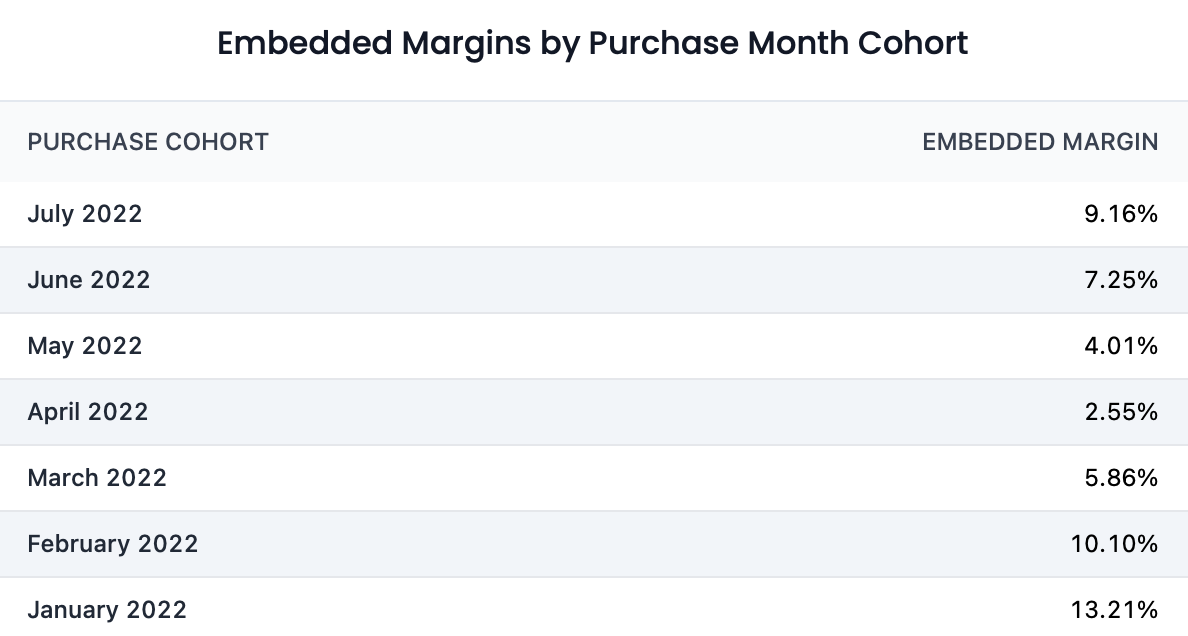
Shockingly, for homes purchased in April and May (49.7% of active listings), current aggregate list price is less than Opendoor paid for the inventory. This is abysmal performance for the company’s oldest market.
So what happened?
Pretty simple. Opendoor overbought Phoenix homes at the end of Q2, which was the peak of home valuation. Now that demand has softened, Opendoor’s Phoenix market is taking it on the chin.
This brings up a weak point in the ibuying thesis:
The hardest part of agilely buying and selling homes in a rapidly shifting market is the purchase lag.
Opendoor can ramp up sales with listings and marketing overnight, but the time frame required to purchase homes is when Opendoor is most vulnerable.
When Opendoor purchases a home, they must first go “under contract.” This phase includes inspections, negotiations, financing and processing, and can take up to 45 days until Opendoor owns the home on the balance sheet. This is the purchase lag.
While real estate generally moves slowly and one month of exposure is almost a rounding error, in this situation Opendoor found themselves under contract with far too many Phoenix homes at precisely the moment the market began to turn. In fact, Phoenix alone is currently dragging Opendoor’s entire Q3 embedded gross margin down by 50 bps.
The Last Week of June
Despite the above, Opendoor appears to be course correcting. Embedded margins are up month-on-month from May through July (if still quite low).
Perhaps most encouragingly, the median price of Phoenix homes purchased the last week of June was $50,000 less than Opendoor paid the first week of June. In fact, at June’s ending Opendoor’s median Phoenix purchase price was the lowest it has been in four months. This is spread beginning to take effect, and has significant implications for Opendoor’s fourth quarter.
Despite these lower offers, Opendoor paradoxically purchased more homes the last week of June in Phoenix than it has since August of 2021.
Remember, in times of uncertainty, Opendoor’s product (instant liquidity and certainty) carries even more value. I’ve said this for over a year now, and this appears to be playing out.
Atlanta Is Doing…Just Fine
While Phoenix is burning, Opendoor’s second oldest market is doing just fine. As of today, Opendoor has sold double the homes in Q3 in Atlanta versus Phoenix, with more than double pending, at nearly double the estimated gross margins.
When you look at the embedded gross margins (forward looking), it’s night and day.
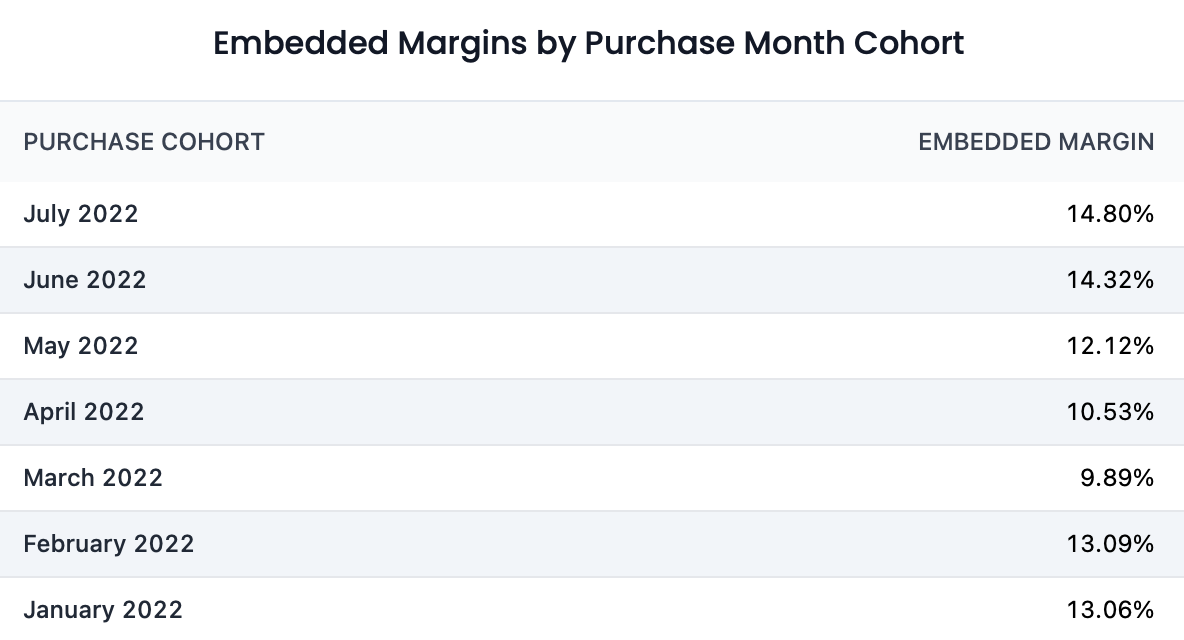
For all Atlanta listed homes purchased by month in 2022 (93.3%), embedded gross margins are double digit or higher in all but one month. Pending margins remain in double digit territory through August. And 25.5% of Opendoor’s current Atlanta listings are pending, compared to only 9.2% for Phoenix.
For all Opendoor’s struggles in Phoenix, Atlanta is seemingly doing…just fine.
Indeed, this is the value of a portfolio approach to ibuying – markets are local and don’t move in tandem. Even though Opendoor is heavily invested in a poorly performing market such as Phoenix, the markets of Atlanta, Orlando, Tampa, Charlotte and Jacksonville are doing quite well, elevating the entire company’s performance.
Wrapping Up
This is an unprecedented time for Opendoor. The macro environment has taken its pound of flesh, and we expect the company to describe these hardships and the Q3 impact in the quarterly report August 4th.
We knew the back half of the year would be challenging – I’ve previously described this as “the crucible moment” for the company. With all the real estate noise on social media, it would be easy to fear Opendoor is headed off the same perilous cliff Zillow did, but that’s not what’s happening. We preliminarily expect Opendoor to meet contribution margins of 4 – 6% in Q3 (although I do expect the lower end of the range).
For this post I chose not to write about Opendoor’s glittery long-term potential or how rapidly they’re scaling a new fintech product. Instead, I focused on their biggest weak point – to bring you the news with the unemotional clarity of numbers.
Opendoor unquestionably has a Phoenix problem, and we will monitor performance here with even greater diligence. Listings data appear to be the most valuable forward-looking analyses on a market-by-market basis, and allow us to see further and further into future performance. We are working to bring these same tools to the Datadoor Atoms dashboard.
Want to learn more about next weeks earnings results? Check out our estimates for Opendoor’s Q2 results and Q3 insights.
Institutional Grade iBuying data.
For Everyone.
Create an account to get access to Opendoor data and analysis.
Create an accountJoin the discussion
Continue the conversation about this article in our Discord community.
Join our Discord