
In September 2020, Opendoor released its first public investor presentation. Management laid out an audacious goal to one day operate in 100 markets, claiming 4% share of all U.S. residential real estate transactions.
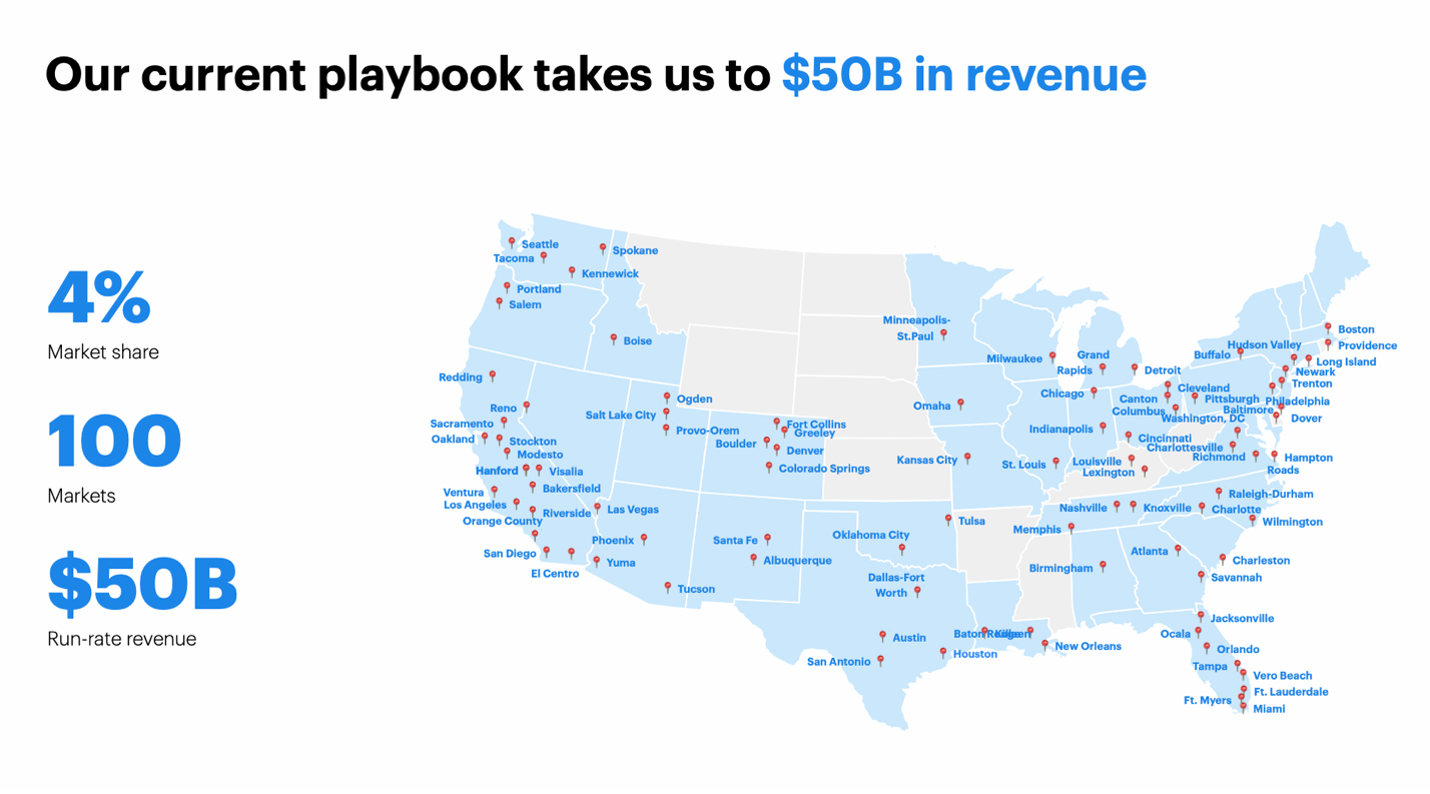
In the words of Zillow CEO Rich Barton, this is what would be called a “BHAG;” a “big hairy audacious goal”. Accomplishing this objective would 20X Opendoor’s annualized IPO revenue, and make it one of the highest grossing companies in the world.
Much has changed since September 2020. More homes are expected to be sold in 2022 than in Opendoor's IPO year, and the average U.S. home has appreciated by over 30%.
The prize of dominating U.S. residential real estate has only gotten richer.
Today, Opendoor is active in 48 markets, nearly halfway to its investor presentation target. But progress on its marketshare goals are not so transparent – that is, unless you have access to a bafflingly accurate real-time transaction engine. (it turns out we do)
For this article I decided to take a few hours to evaluate Opendoor’s marketshare progress; whether or not the company is making good on the lofty goals laid out nearly two years ago.
Let's start with this graph, which I found in Opendoor’s original investor presentation.
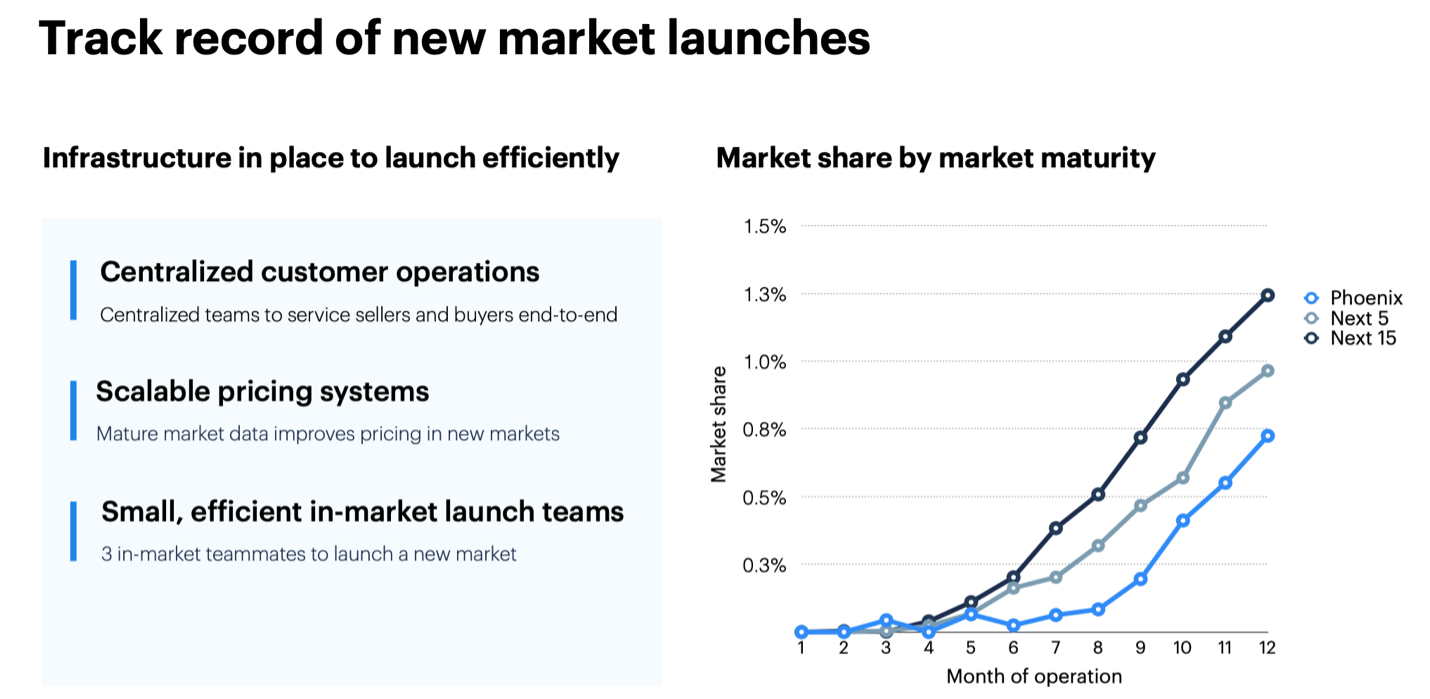
This graph gives you an idea of Opendoor's intended pace to reach 4% marketshare. Importantly, it also suggests that the velocity of Opendoor’s scaling playbook can be optimized with each incremental market launch.
But this is an investor presentation. It’s pretty and linear, and conceals the peaks and troughs that make this business – and building it – so compelling. So instead, using the Datadoor engine, let's examine the company's actual performance in granularity.
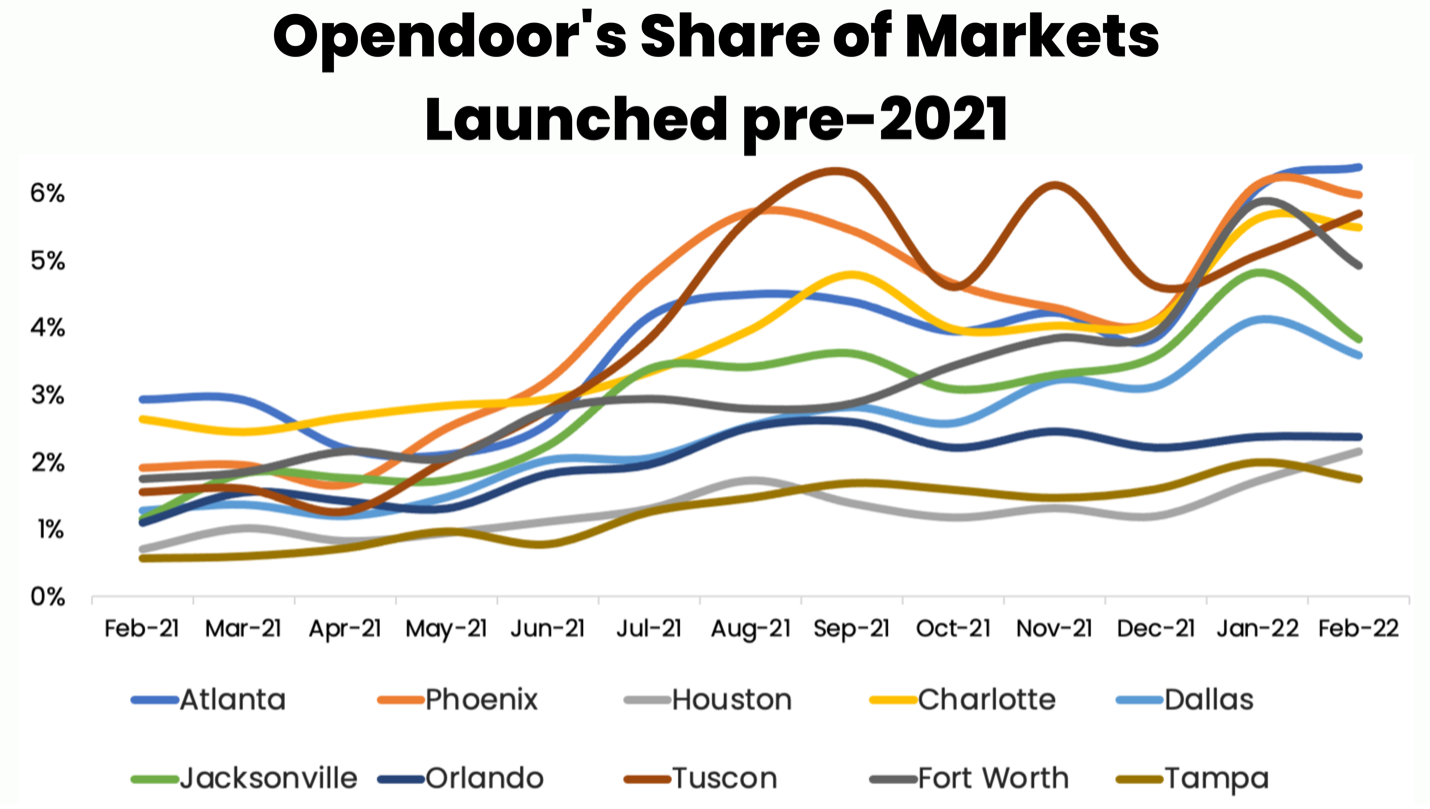
Above you will find Opendoor’s top ten largest markets by volume, each launched prior to 2020. These are Opendoor’s OG markets (original geographies, obviously), and today 61% of total sales volume occurs in just these ten markets.
As of February 2022, mean OG marketshare has more than doubled year-over-year, from 1.56% to 4.22%. Opendoor’s two prime markets (prime: markets where Opendoor sells > 1,000 homes per quarter), Atlanta and Phoenix, just breached 6% marketshare for the first time since the COVID-19 pandemic began.
Importantly, marketshare in non-prime geographies is growing even faster, which means both revenue diversification and less reliance on only two markets. Marketshare in all non-prime OG markets has more than tripled year-over-year. In fact, Opendoor has achieved 4% marketshare in all but three of the above markets.
While reviewing these data, I wondered which of Opendoor’s current geographies will represent its next prime market. Houston, Charlotte, Dallas, and Jacksonville will each likely cross 500 sales in Q3. I expect one to emerge as Opendoor’s third prime market by Q1 2023. However, as Atlanta is poised to breach 1,500 sales in Q2 alone, I expect Hot ‘Lanta to achieve double-prime status well before a new prime is crowned.
It seems the growth thesis is alive and well in these flagship geographies. But Opendoor has been operating in these markets for years. How quickly can they achieve scale in newly minted markets – how much has their playbook actually improved?

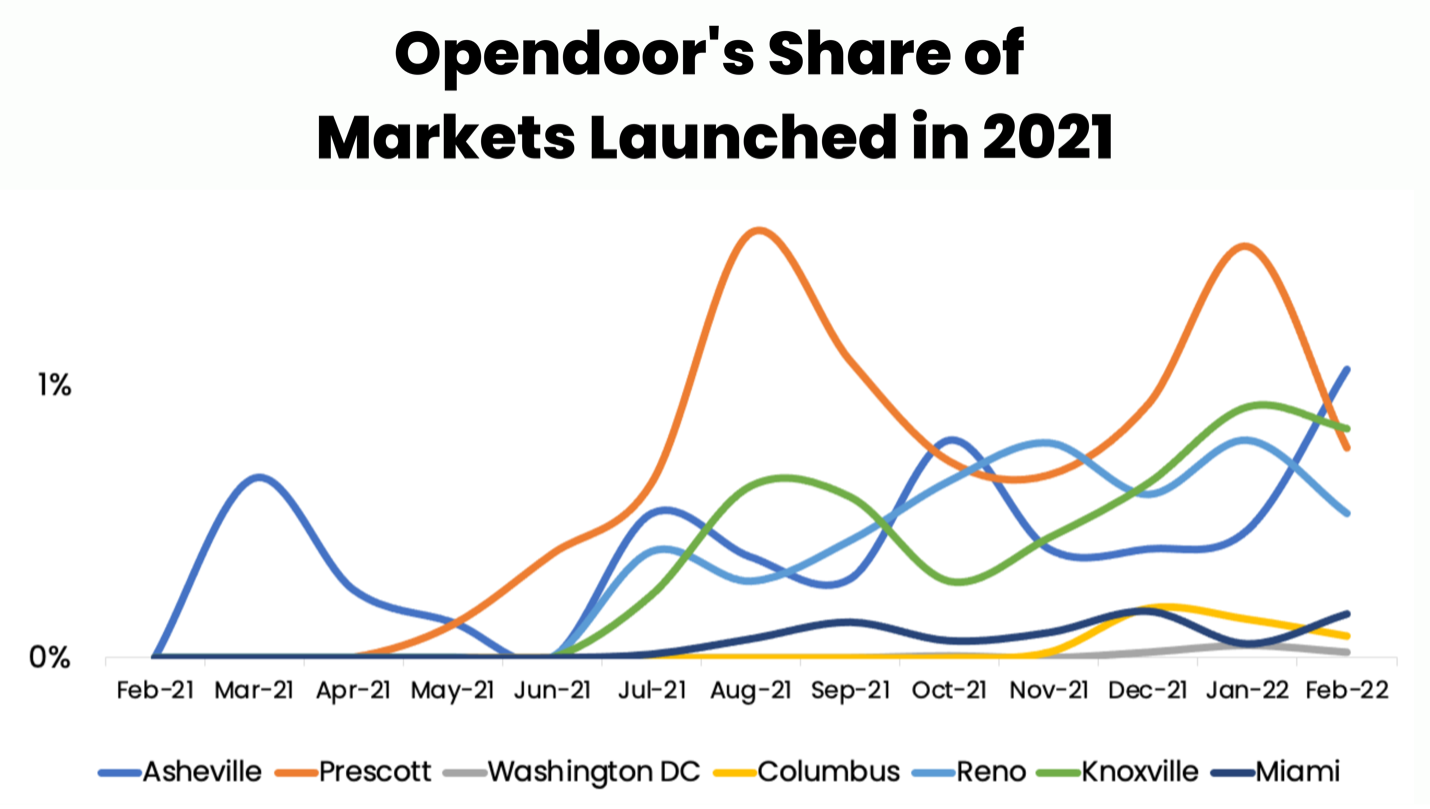
Above are Opendoor’s ten largest markets launched in 2021. As of February 2022, mean marketshare across these geographies is 1%. As these markets have averaged only 6 months of operation each, marketshare growth here is superior to prior cohorts.
Kileen and Greensboro in particular have already breached 2% (with Q2 transaction data even higher), although the markets of Boise, Indianapolis and Cleveland are lagging well behind guided pace.
And volume isn’t the only metric to weigh. Prudent unit economics oppose new market growth, and for this cohort, it’s a mixed bag. For example, Kansas City and St. Louis are the worst performing markets in Opendoor’s Q2 portfolio, with mid-single digit gross profit margins. On the other hand, Greensboro, Indianapolis and Cleveland each tout high teens margins today.
While the above markets demonstrate a clear growth trajectory, they only tell half the story. These are the largest of Opendoor’s newly launched markets by volume, but what about the smallest?
Above are the smallest markets Opendoor launched in 2021. Collectively, they represent only 0.9% of all Opendoor Q2 home sales, and mean February marketshare is only 0.49%.
That said, these are generally newer geographies than the previous 2021 cohort, averaging 5 months of operation each. And surprisingly, these markets operate with much greater precision than their larger 2021 littermates, with Q2 gross profit margins in the mid-teens. The lowest margin market in this cohort is Asheville, at a crisp 12.7%.
These superior unit economics make sense, as Opendoor is both conservative and selective about the first few homes it transacts in new markets. As Opendoor gains confidence in its pricing and the market-specific nuances, it scales to new levels, and repeats the cycle.
Time will tell whether or not these geographies fulfill the torrid growth objectives in Opendoor’s presentation, but early results suggest these markets deserve to be scaled further.
This brings us to overall performance. At today’s $20 billion dollar revenue run rate, how close is Opendoor to achieving that mythical 4% marketshare of ALL transactions?
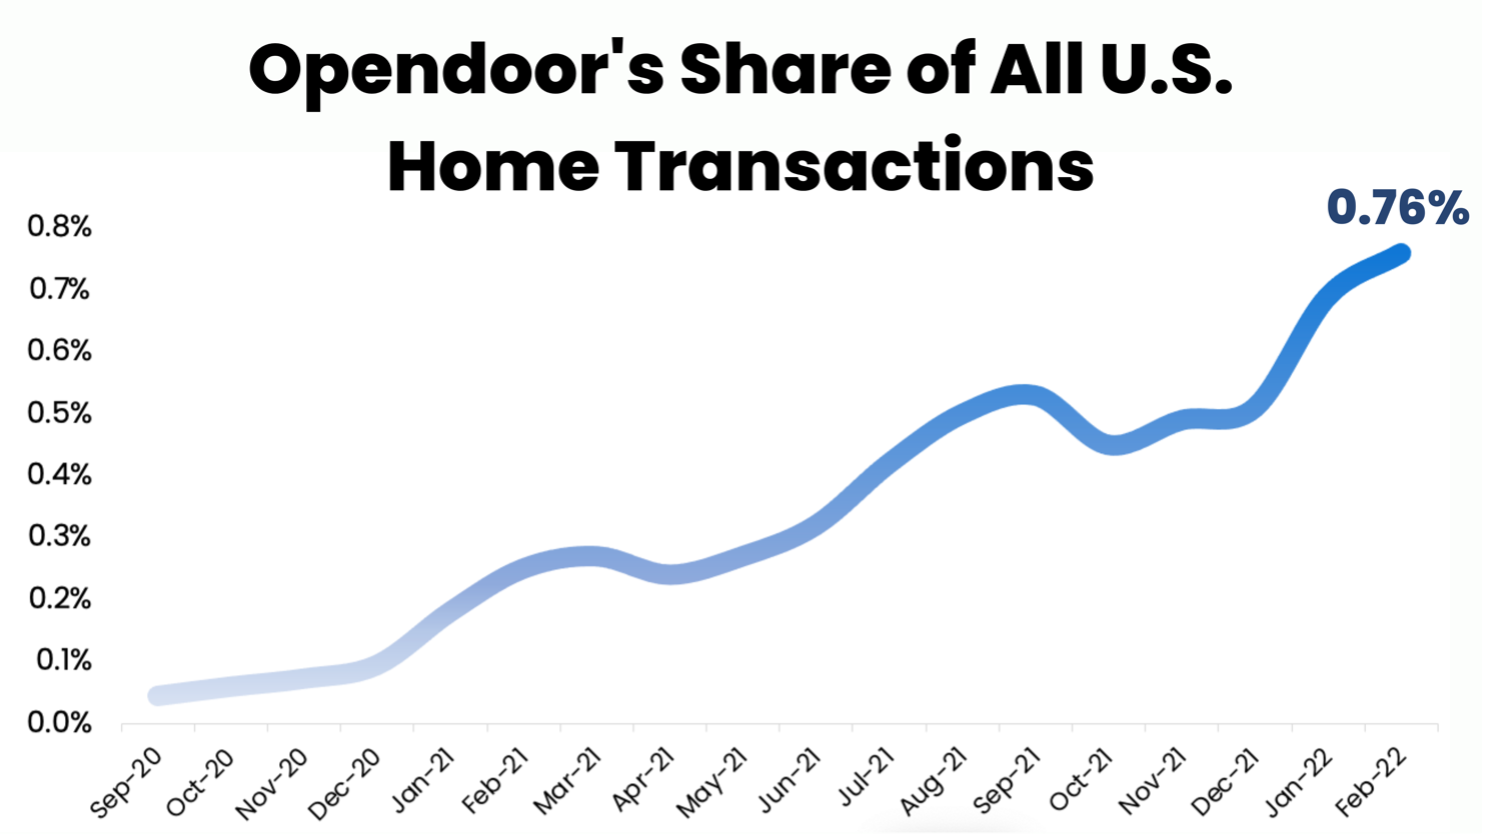
It turns out, Opendoor is exactly 20% of the way there. Although there are some ebbs and flows in Opendoor’s scaling efforts, the slope has averaged roughly 0.04% U.S. marketshare growth per month since IPO.
If Opendoor were to maintain this growth trajectory we wouldn’t see 4% marketshare until 2030. But Opendoor’s marketshare slope is actually increasing. So far in 2022, Opendoor has gained a remarkable 0.075% marketshare growth per month, bolstered by higher levels of inventory and fresh market launches.
At IPO Opendoor operated in only 21 markets, but has since expanded to 48. With each launch Opendoor’s growth rate compounds, and greater brand recognition improves marketing efficiency.
In this way Opendoor is perhaps one of the easiest growth stories to internalize, despite its penchant for being misunderstood. Opendoor can demonstrate outsized growth over the coming decade simply by launching new geographies – where there exists no competition besides a broken, analog, offline experience. Opendoor’s model is as easy to understand as a lemonade stand business that continues to expand into new neighborhoods, where the only alternative is warm – and infuriatingly metallic – tap water.
I believe new market launches, plus moderate continued growth in OG markets, puts Opendoor on a path to hit 4% U.S. marketshare by 2025. And the revenue implications of 4% marketshare in 2025 are far above Opendoor’s original guidance for $50 billion (today’s 0.76% share equates to $20 billion revenue run-rate, do that math).
We at Datadoor will continue to track these metrics and keep you updated.
Tyler
Institutional Grade iBuying data.
For Everyone.
Create an account to get access to Opendoor data and analysis.
Create an accountJoin the discussion
Continue the conversation about this article in our Discord community.
Join our Discord